Financial Review
Summary
In 2017, the Company deepened its reform and innovation and accelerated the scale development leading by its transformation and upgrades strategy. Development capabilities were continuously accumulated while efficiency and effectiveness were successfully enhanced. As a result, the overall operating results achieved steady growth. Operating revenues in 2017 were RMB366,229 million, an increase of 3.9% from year 20161; service revenues2 were RMB331,044 million, an increase of 6.9% from year 2016; operating expenses were RMB339,009 million, an increase of 4.2% from year 2016; profit attributable to equity holders of the Company was RMB18,617 million, an increase of 3.3% from year 2016; basic earnings per share were RMB0.23; EBITDA3 was RMB102,171 million, an increase of 7.4% from year 2016 and the EBITDA margin4 was 30.9%, an increase of 0.2 percentage point from last year.
Operating Revenues
In 2017, the Company insisted on integration and innovation, and effectively responded to market competition. The subscribers scale grew rapidly and the revenue structure was continuously optimised with steady growth in operating revenues. Operating revenues in 2017 were RMB366,229 million, an increase of 3.9% from year 2016. Of which, total mobile revenues were RMB180,535 million, an increase of 4.8% from year 2016; total wireline revenues were RMB185,694 million, an increase of 3.0% from year 2016.
- In 2017, the Group acquired the satellite communications business and Shaanxi Zhonghe Hengtai Insurance Agent Limited (陝西中和恒泰保險代理有限公司). As the transaction was recognised as a combination of entities under common control, the comparative figures of prior years have been restated accordingly. Please refer to note 1 of the audited consolidated financial statements for details.
- Service revenues were calculated based on operating revenues minus sales of mobile terminals (2017: RMB26,759 million; 2016: RMB34,612 million), sales of wireline equipment (2017: RMB6,446 million; 2016: RMB5,902 million) and other non-service revenues (2017: RMB1,980 million; 2016: RMB2,208 million).
- EBITDA was calculated based on operating revenues minus operating expenses plus depreciation and amortisation. As the telecommunications business is a capital intensive industry, capital expenditure, the level of gearing and finance costs may have a significant impact on the net profit of companies with similar operating results. Therefore, we believe EBITDA may be helpful in analysing the operating results of a telecommunications service provider such as the Company. Although EBITDA has been widely applied in the global telecommunications industry as a benchmark to reflect operating performance, debt raising ability and liquidity, it is not regarded as a measure of operating performance and liquidity under generally accepted accounting principles. It also does not represent net cash from operating activities. In addition, our EBITDA may not be comparable to similar indicators provided by other companies.
- EBITDA margin was calculated based on EBITDA divided by service revenues.
The following table sets forth a breakdown of the operating revenues for 2016 and 2017, together with their respective rates of change:
| For the year ended 31 December | |||
| (RMB millions, except percentage data) | 2017 | 2016 (restated) |
Rates of change |
| Voice | 61,678 | 70,185 | -12.1% |
| Internet | 172,554 | 1 50,449 | 14.7% |
| Information and application services | 73,044 | 66,881 | 9.2% |
| Telecommunications network resource services and lease of network equipment |
19,125 | 17,781 | 7.6% |
| Others | 39,828 | 47,238 | -15.7% |
| Total operating revenues | 366,229 | 352,534 | 3.9% |
Voice
In 2017, being continuously affected by the substitution effect of mobile Internet services such as OTT, revenue from voice services was RMB61,678 million, a decrease of 12.1% from year 2016, accounting for 16.8% of operating revenues. Of which, revenue from wireline voice services was RMB22,263 million, a decrease of 14.3% from year 2016; revenue from mobile voice services was RMB39,415 million, a decrease of 10.8% from year 2016. The risks associated with revenue from voice services were further mitigated while the revenue structure was continuously optimised.
Internet
In 2017, revenue from Internet services was RMB172,554 million, an increase of 14.7% from year 2016, accounting for 47.1% of operating revenues. The Company further deepened its integrated operation and strengthened applications enrichment. With optimisation in network and service quality, we are able to reinforce our leading position in the broadband market. Besides, we strived to preserve our corporate value while expanding the scale development of broadband subscribers. At the end of 2017, the number of wireline broadband subscribers reached 134 million, with a net increase of 10.41 million. The wireline broadband revenue was RMB76,744 million, which was relatively stable as compared with that of year 2016. The Company well planned the all-rounded 4G development through active promotion of popularity of “multi-mode” handsets, innovative introduction of large data traffic products and continuous construction of the superior 4G network, providing new engines for the fast-growing mobile services and effectively driving the rapid increase in mobile data traffic and related revenue. Revenue from mobile Internet access services was RMB92,961 million, an increase of 31.5% from year 2016. Of which, mobile handset Internet access revenue was RMB90,865 million, an increase of 33.1% from year 2016.
Information and Application Services
In 2017, revenue from information and application services was RMB73,044 million, an increase of 9.2% from year 2016, accounting for 20.0% of operating revenues. Of which, revenue from wireline information and application services was RMB52,037 million, an increase of 17.3% from year 2016, mainly benefiting from the rapid growth of IDC, cloud, Big Data and e-Surfing HD services. Revenue from mobile information and application services was RMB21,007 million, a decrease of 6.7% from year 2016, which was mainly due to the decrease in revenue from traditional value-added services such as information inquiry services.
Telecommunications Network Resource Services and Lease of Network Equipment
In 2017, revenue from telecommunications network resource services and lease of network equipment was RMB19,125 million, an increase of 7.6% from year 2016, accounting for 5.2% of operating revenues. Of which, revenue from wireline telecommunications network resource services and lease of network equipment was RMB18,835 million, an increase of 7.0% from year 2016, which was mainly due to the favourable growth in revenue from the IP-VPN service and digital circuit service.
Others
In 2017, revenue from other services was RMB39,828 million, a decrease of 15.7% from year 2016, accounting for 10.9% of operating revenues. Revenue from sales of mobile terminals was RMB26,759 million, a decrease of 22.7% from year 2016, which was mainly attributable to the enhanced promotion and increasing popularisation of “multi-mode” handsets, the increase of number of terminals sold through open channels as well as the reduction in the Company’s centralised procurement, resulting in the decline in revenue from sales of terminals.
Operating Expenses
The Company continued to optimise the cost structure and ration alised the allocation of resources in order to support the scale development. In 2017, operating expenses were RMB339,009 million, an increase of 4.2% from year 2016. Operating expenses accounted for 92.6% of operating revenues, an increase of 0.3 percentage point from year 2016.
The following table sets forth a breakdown of the operating expenses in 2016 and 2017 and their respective rates of change:
| For the year ended 31 December | |||
| (RMB millions, except percentage data) | 2017 | 2016 (restated) |
Rates of change |
| Depreciation and amortisation | 74,951 | 67,942 | 10.3% |
| Network operations and support | 103,969 | 94,156 | 10.4% |
| Selling, general and administrative | 58,434 | 56,426 | 3.6% |
| Personnel expenses | 56,043 | 54,504 | 2.8% |
| Other operating expenses | 45,612 | 52,286 | -12.8% |
| Total operating expenses | 339,009 | 325,314 | 4.2% |
Depreciation and Amortisation
In 2017, depreciation and amortisation was RMB74,951 million, an increase of 10.3% from year 2016, accounting for 20.5% of operating revenues. The increase was mainly due to the changes in accounting depreciable lives of certain fixed assets from 10 years to 5 years by the Company with effect from 1 October 2017, and accordingly the depreciation expenses increased by RMB4,045 million. Meanwhile, since the Company continued with its large-scale investment in the development of 4G and fibre broadband network in recent years, the increase in depreciation of newly added assets outweighed the decrease in depreciation of the existing assets.
Network Operations and Support
In 2017, network operations and support expenses were RMB103,969 million, an increase of 10.4% from year 2016, accounting for 28.4% of operating revenues. It was mainly due to the increase in the tower assets lease fee and the costs of repairs and maintenance attributed to the enhancement of network capabilities and quality. At the same time, the Company implemented stringent cost management and control and therefore, the increase in network operations and support expenses was under effective control.
Selling, General and Administrative
In 2017, selling, general and administrative expenses amounted to RMB58,434 million, an increase of 3.6% from year 2016, accounting for 16.0% of operating revenues. Selling expenses were RMB50,345 million, an increase of 5.3% from year 2016. The Company continuously optimised its sales and marketing model, appropriately increased its investment in channel costs and significantly reduced the terminal subsidies, achieving enhancement in the overall utilisation effectiveness of sales and marketing expenses. Of which, commission and service expenses for third parties amounted to RMB36,273 million, an increase of 17.9% from year 2016. Advertising and promotion expenses amounted to RMB14,072 million, a decrease of 17.6% from year 2016, of which the terminal subsidies amounted to RMB4,707 million, a decrease of 49.8% from year 2016.
Personnel Expenses
In 2017, personnel expenses were RMB56,043 million, an increase of 2.8% from year 2016, accounting for 15.3% of operating revenues. For details of the number of employees, remuneration policies and training schemes, please refer to the Environmental, Social and Governance Report in the Annual Report for the year ended 31 December 2017.
Other Operating Expenses
In 2017, other operating expenses were RMB45,612 million, a decrease of 12.8% from year 2016, accounting for 12.4% of operating revenues. The cost of mobile terminal equipment sold amounted to RMB25,488 million, a decrease of 22.5% from year 2016, which was in line with the decrease in revenue from sales of mobile terminals.
Net Finance Costs
In 2017, net finance costs were RMB3,291 million, an increase of 1.7% from year 2016. Net exchange loss amounted to RMB134 million in year 2017. The fluctuation of foreign exchange gain or loss was mainly due to the effect of changes in the exchange rate of RMB against USD.
Profitability Level
Income Tax
The Company’s statutory income tax rate is 25%. In 2017, income tax expenses were RMB6,192 million with the effective income tax rate of 24.8%. The difference between the effective income tax rate and the statutory income tax rate was mainly due to the preferential income tax rate, which was lower than the statutory income tax rate, enjoyed by some of our branches with operations in the western region of China and some of our subsidiaries.
Profit Attributable to Equity Holders of the Company
In 2017, profit attributable to equity holders of the Company was RMB18,617 million, an increase of 3.3% from year 2016.
Changes in Accounting Estimates
Since the implementation of transformation and upgrades strategy in June 2016, the Company has expedited the construction of new generation network, continuously raising the demand for high performance and rapid cannibalisation of assets. Following an assessment conducted during the year, the Company considered that there were changes in the expected useful lives of the enterprise information system equipment, IPTV equipment and CDN equipment along with the fast high-definition development of the video services, the rapid evolution of information technology and the accelerated cannibalisation of equipment. To ensure the accounting depreciable lives of fixed assets better reflecting the condition of actual usage of the assets, the Company resolved to change the accounting depreciable lives of the above assets from 10 years to 5 years in order to further reinforce assets quality and enhance the market competitiveness of our services, which will in turn promote the long-term sustainable development of the Company. The above changes have been implemented with effect from 1 October 2017. These changes in accounting estimates resulted in the corresponding increase of depreciation expenses by RMB4,045 million in year 2017.
Capital Expenditure and Cash Flows
Capital Expenditure
In 2017, the Company continued to enhance its management and control of capital expenditure, consistently optimised the investment structure as well as took advantage of Big Data to implement precision investment, which resulted in improvement of the investment efficiency and effectiveness. In 2017, capital expenditure was RMB88,712 million, a decrease of 8.4% from year 2016.
Cash Flows
Net decrease in cash and cash equivalents in 2017 was RMB4,908 million while the net decrease in cash and cash equivalents in year 2016 was RMB7,463 million.
The following table sets forth the cash flow position in 2016 a nd 2017:
| For the year ended 31 December | ||
| (RMB millions) | 2017 | 2016 (restated) |
| Net cash flow from operating activities | 96,502 | 101,135 |
| Net cash flow used in investing activities | (85,263) | (99,043) |
| Net cash flow used in financing activities | (16,147) | (9,555) |
| Net decrease in cash and cash equivalents | (4,908) | (7,463) |
In 2017, the net cash inflow from operating activities was RMB96,502 million, a decrease of 4.6% from year 2016, which was mainly due to the increase in expenses related to operating activities.
In 2017, the net cash outflow used in investing activities was RMB85,263 million, a decrease of 13.9% from year 2016, which was mainly due to the decrease in capital expenditure.
In 2017, the net cash outflow used in financing activities was RMB16,147 million, an increase of 69.0% from year 2016, which was mainly due to the higher amount of repayment of deferred consideration of mobile network acquisition due this year than the newly obtained borrowings.
Working Capital
The Company consistently upheld prudent financial principles and stringent fund management policies. At the end of 2017, working capital (total current assets minus total current liabilities) deficit was RMB203,858 million, a decrease in deficit of RMB41,141 million from year 2016. The decrease in deficit was mainly due to the repayment of deferred consideration of mobile network acquisition due this year. As at 31 December 2017, the unutilised credit facilities were RMB154,793 million (2016: RMB161,229 million). Given the stable net cash inflow from operating activities and the sound credit record, the Company has sufficient working capital to satisfy the operation requirement. At the end of 2017, cash and cash equivalents amounted to RMB19,410 million, amongst which cash and cash equivalents denominated in Renminbi accounted for 81.6% (2016: 81.8%).
Assets and Liabilities
In 2017, the Company continued to maintain a solid financial position. At the end of 2017, the total assets increased by 1.3% to RMB661,194 million from RMB652,558 million at the end of 2016. Total indebtedness decreased to RMB104,377 million from RMB112,528 million at the end of 2016. The ratio of total indebtedness to total assets decreased to 15.8% from 17.2% at the end of 2016.
Indebtedness
The indebtedness analysis as at the end of 2016 and 2017 is as follows:
| For the year ended 31 December | ||
| (RMB millions) | 2017 | 2016 |
| Short-term debt | 54,558 | 40,780 |
| Long-term debt and payable maturing within one year |
1,146 | 62,276 |
| Long-term debt | 48,596 | 9,370 |
| Finance lease obligations (including current portion) |
77 | 102 |
| Total debt | 104,377 | 112,528 |
By the end of 2017, the total indebtedness was RMB104,377 million, a decrease of RMB8,151 million from the end of 2016, which was mainly due to the effective reduction in scale of interest-bearing debt as a result of the efficient centralised capital management implemented by the Company. Of the total indebtedness, loans denominated in Renminbi, US Dollars and Euro accounted for 99.4% (2016: 99.4%), 0.4% (2016: 0.4%) and 0.2% (2016: 0.2%), respectively. 99.5% (2016: 44.3%) of the indebtedness are loans with fixed interest rates, while the remaining portion of the indebtedness represented loans with floating interest rates.
As at 31 December 2017, neither the Company nor any of its subsidiaries pledge any assets as collateral for debt (2016: Nil).
Most of the revenues received and expenses paid in our business were denominated in Renminbi, therefore there were no significant risk exposures arising from foreign exchange fluctuations.
Investment in China Tower
In 2017, the Company held 27.9% of China Tower Corporation Limited (“China Tower”). Please refer to note 9 of the audited consolidated financial statements for its financial performance during the year. In the future, the Company can enjoy more fundamental network resources through China Tower. As one of the shareholders of China Tower, it is expected that we can benefit from the enhancement of profits and values from China Tower.
Contractual Obligations
| (RMB millions) | Total | 1 January 2018 to 31 December 2018 |
1 January 2019 to 31 December 2019 |
1 January 2020 to 31 December 2020 |
1 January 2021 to 31 December 2021 |
1 January 2022 to 31 December 2022 |
Thereafter |
| Short-term debt | 55,682 | 55,682 | _ | - | - | - | - |
| Long-term debt | 58,543 | 2,725 | 2,716 | 22,719 | 1,942 | 21,951 | 6,490 |
| Operating lease commitments | 69,766 | 20,680 | 19,563 | 16,730 | 6,631 | 3,376 | 2,786 |
| Capital commitments | 11,246 | 11,246 | - | - | - | - | - |
| Total contractual obligations | 195,237 | 90,333 | 22,279 | 39,449 | 8,573 | 25,327 | 9,276 |
| Note: Amounts of short-term debt, and long-term debt include recognised and unrecognised interest payable, and are not discounted. | |||||||
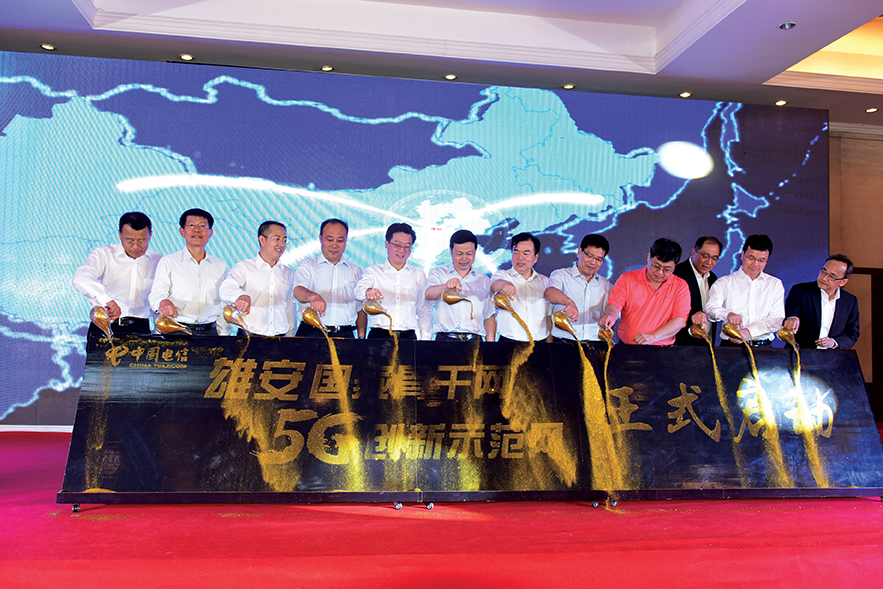
Launch ceremony for the construction of national backbone network & 5G innovative demo network in Xiong’an
Management signed the strategic cooperation framework with the Qingdao government